|
Introductory Concepts Illustration Option Create a visual/graphical diagram by hand or using software that describes the phase change diagram. Necessary criteria:
VERSION ONE: Graphic Design Organizer I made a graphic organizer chart of the relationship between matter, substance, elements, compounds, chemistry, mixture, atom, etc. I wanted to straight forwardly display the relations between these concepts. And so I created a diagram that showed the different components branching out to others. They showed the definition of each. First Draft: Here is my first draft of the graphic organizer. I wrote definitions for each of the topics and put arrows connecting to each concept. 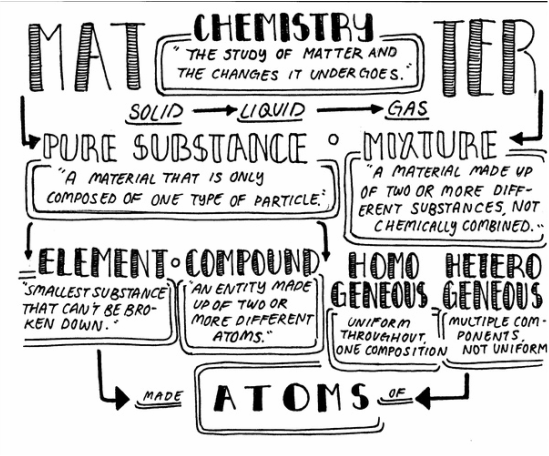 Critique I received:
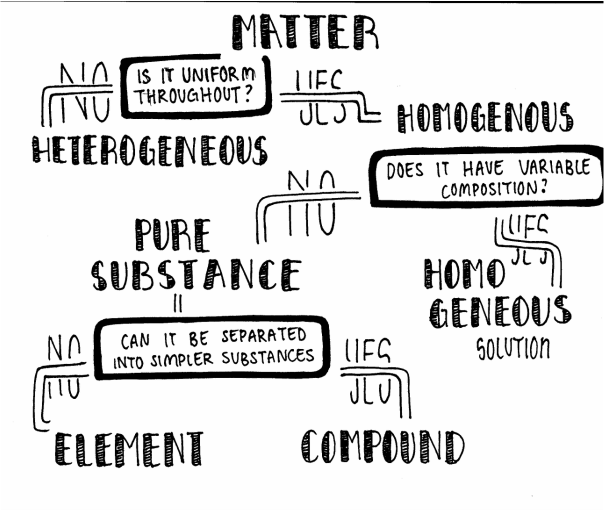
2nd Draft: This is the second draft of graphic organizer. The quality of the scan isn't as good as the other two. But I still incorporated the critique people asked for. I used a larger paper to make the graphic organizer. I put some examples of the different substances below their definitions. I also added a definition for what atoms were. 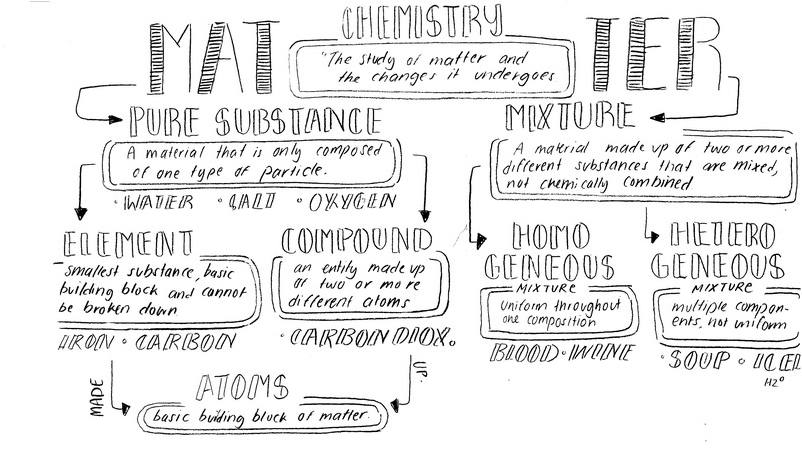 Added Extra: Question based Organizer I created a question organizer. It helps identify certain concepts based on a set of questions. The organizer will have different questions that will ask something that was either relevant or non-relevant to one of the topics. Yes and no will lead it to different concepts. Example: Is it uniform throughout?
1 Comment
Andrew
14/9/2015 11:23:02
Whoaaa... This infographic is awesome. Great work Annika! I want to print this out. Leave a Reply. |
AuthorWrite something about yourself. No need to be fancy, just an overview. Archives
December 2015
Categories |
 RSS Feed
